
APM Applications with Metrics
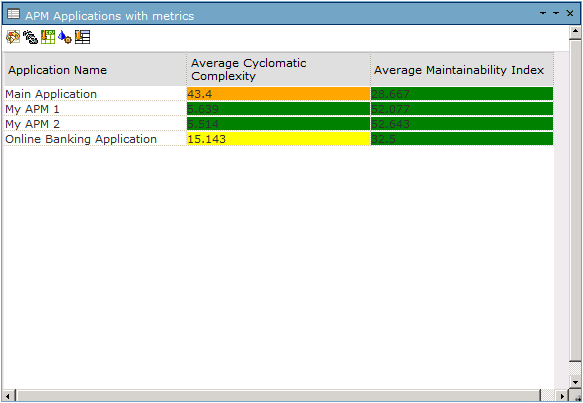
The APM Applications with Metrics query enables you to retrieve all the APMs that have metrics values calculated and display the result in a color-coded score table.
To open the APM metrics score table
| > | Double-click the shortcut or right-click and select Run Query from the context menu. The score table displays. |
| > |
|
The color codes represent these values.
| Color | Range Value | |
|---|---|---|
| Average Cyclomatic Complexity | Average Maintainability Index | |
|
Green |
average <= 10 |
20 <= average |
|
Yellow |
10 < average <= 20 |
10 <= average < 20 |
|
Orange |
20 < average <= 50 |
n/a |
|
Red |
50 < average |
average < 10 |
becubic administrators or users with the relevant permissions can customize the associated layout to change the value ranges to match your own specific company needs.