
Configuring Portlets on the Dashboard
You can add these types of portlets to the Dashboard:
| • | Chart portlets - Display numerical data and key figures for specific types of data in chart format. There are various types of charts available (pie charts, bar charts, etc.). |
| • | Ticker portlets - Display workflow-related information (such as, your open tasks and a list of data that have been changed recently) |
| • | Search portlets - Enable you to search for specific types of metadata. For details, see Searching for Items. |
| • | The Favorites portlet - Display your list of favorite portlets. |
| 1. | From the main menu, select Window ConfigureConfigure Portlets. ConfigureConfigure Portlets. |
Or
On the Dashboard, click the Configure button:
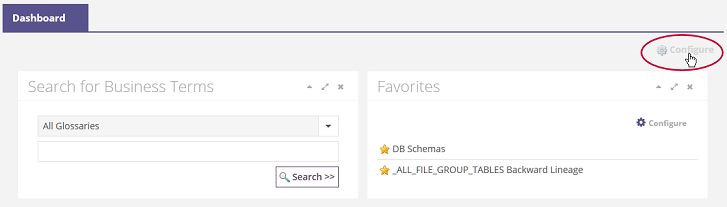
The Configure Portal dialog opens:
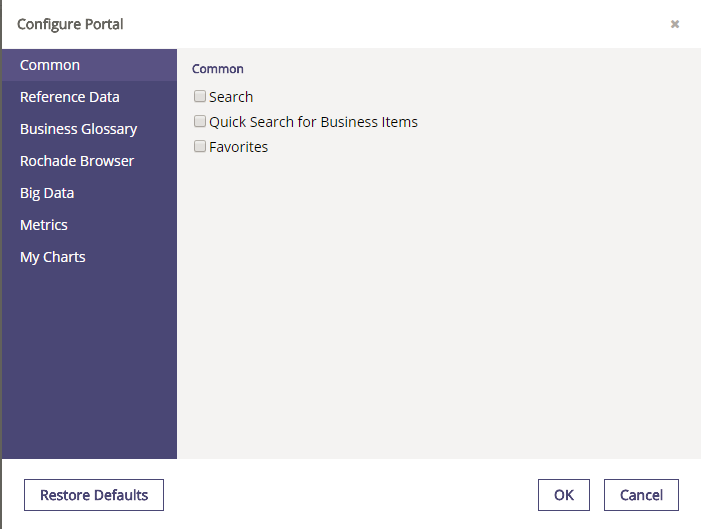
| 2. | Select the check box of each portlet that you want to add to the Dashboard, and clear the check boxes of the portlets you want to remove. |
| 3. | Click OK to save your changes and close the dialog. |
| 1. | From the main menu, select WindowConfigureConfigure Portlets. |
Or
On the Dashboard, click the Configure button.
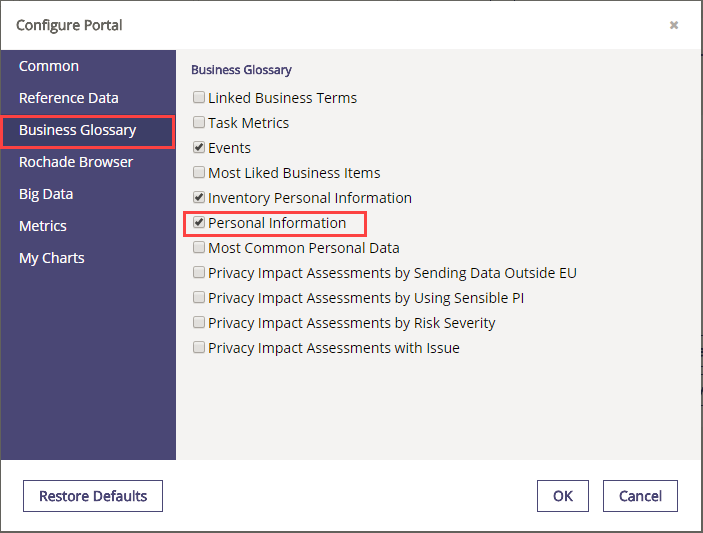
| 2. | Select the Business Glossary section and select the required check boxes to view the PI related portlets on the Dashboard. |
| 3. | Click OK to save your changes and close the dialog. |
On the Dashboard, the Personal Information dashboard displays the number of Personal Information for a specific glossary by these domains: Category, Classification, or Closure rule.
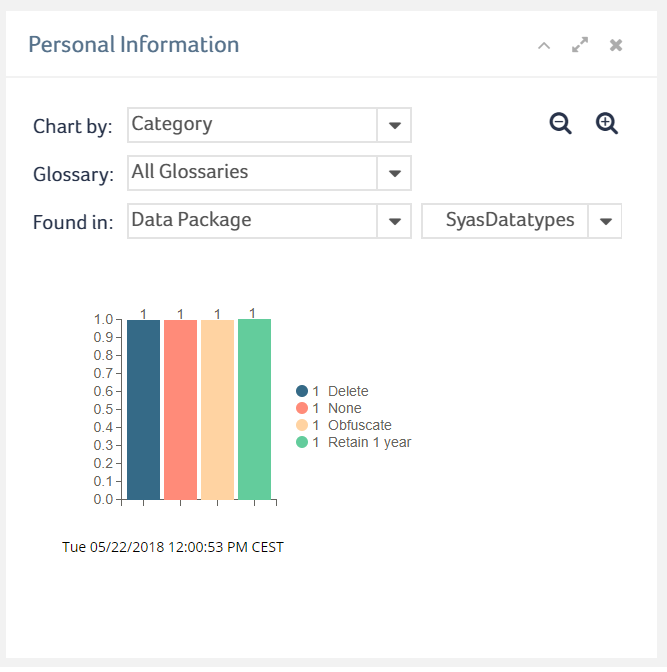
You can further restrict the results using the Found in option. You can use this drop-down option to filter the results based on the source type. After selecting a source type, if you want to further restrict the results based on a particular metadata source, then you must select the name of the source from the drop-down list to filter the results based on the specified source name.