Using Chart Portlets
Chart portlets enable you to visualize data in various types of charts. Presenting numerical data in a graphical way can help to convey valuable information at a glance. Depending on the Rochade applications you have installed, chart portlets are available for a wide range of data, including inventory data, usage statistics, and other key metrics.
These are the available chart portlets:
| Chart Portlet | Description |
|---|---|
|
Anomaly Metrics (Production/Development) |
Displays the number of anomalies found in approved data concepts and in data concepts that are currently in process. |
|
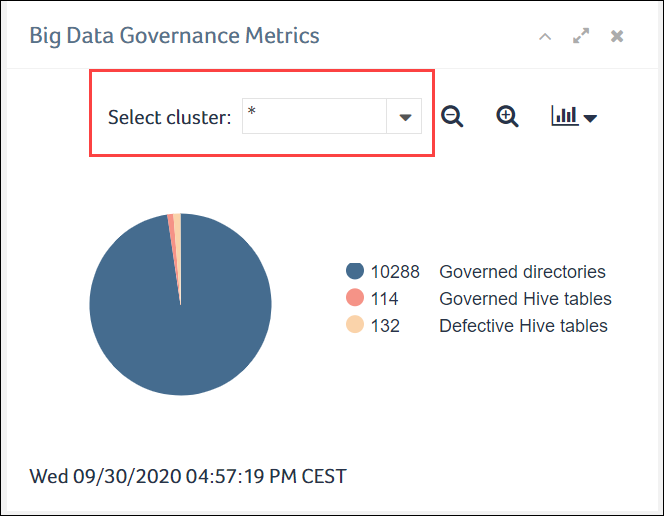
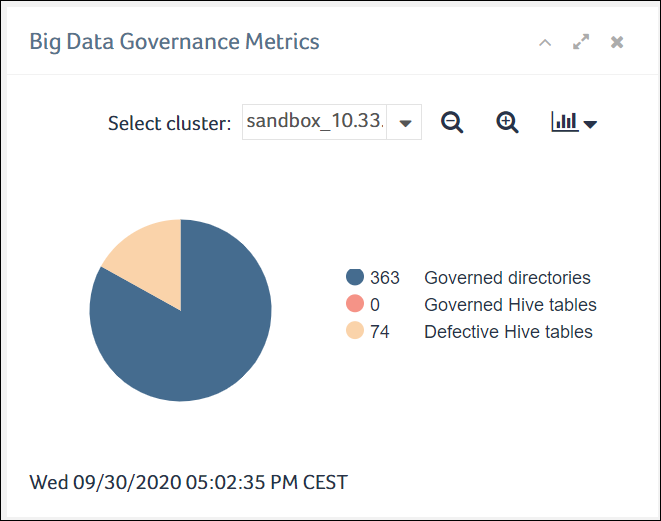
Big Data Governance Metrics |
Displays the number of governed directories, governed Hive tables, and defective Hive tables of a selected big data cluster. The portlet is available only if a big data scanner is installed in the Rochade environment and the item types of the scanner are available in the metaApps subject area. |
|
Chart by <column> |
User-defined charts that visualize the distribution of data in selected query results or item lists. For details, see Generating User-Defined Chart Portlets. |
|
DQ Trend Chart for <item> |
User-defined charts that visualize changes in the data quality for selected items over a specific period of time. For details, see Generating DQ Trend Chart. |
| Events | Displays the open tasks awaiting your action and lists the key figures about workflow-related data. For details, see Using Ticker Portlets. |
|
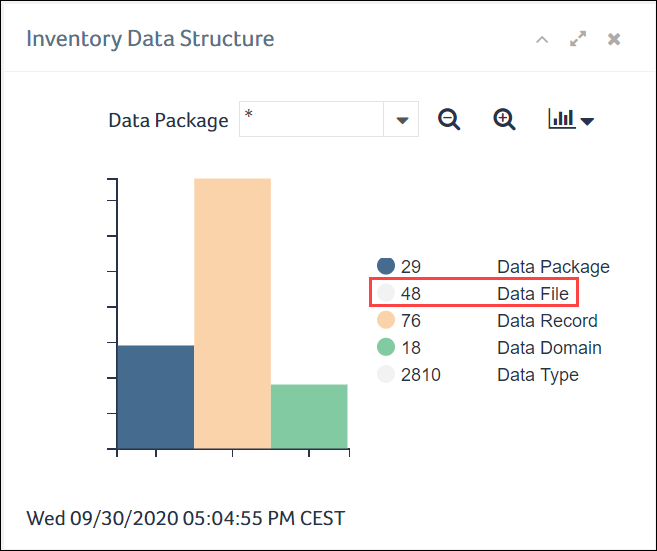
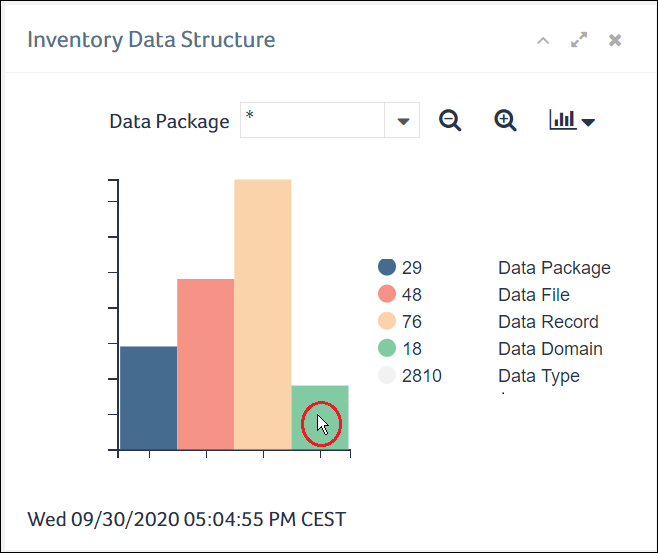
Inventory Data Structure |
Displays the number of data structure items such as packages, files, records, domains, and data types. |
|
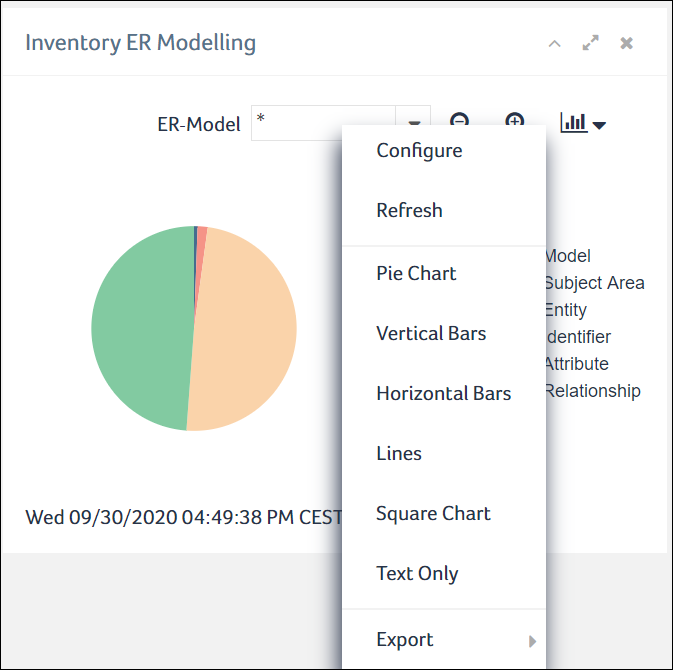
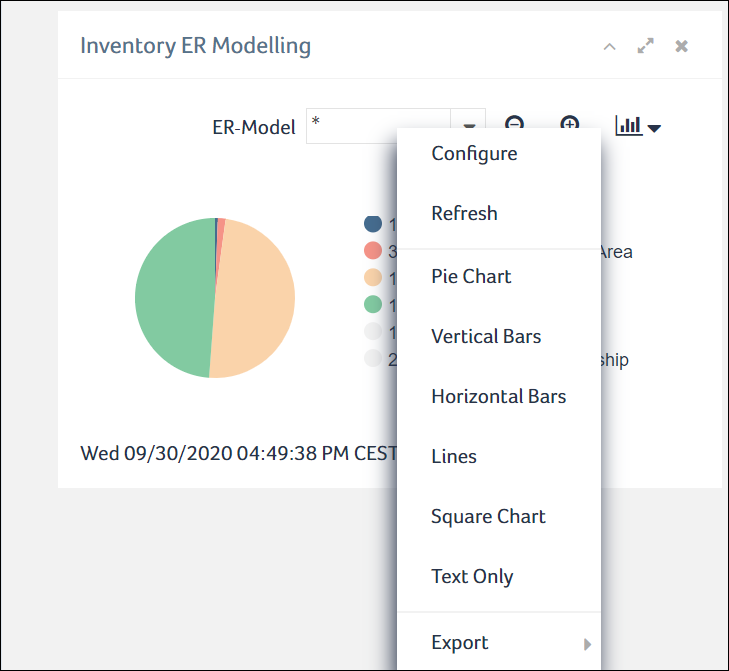
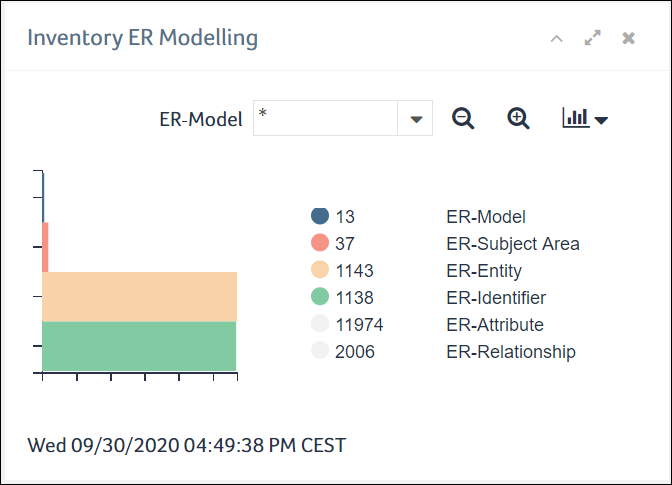
Inventory ER Modeling |
Displays the number of entity relationship items such as models, subject areas, entities, identifiers, attributes, and relationships. |
|
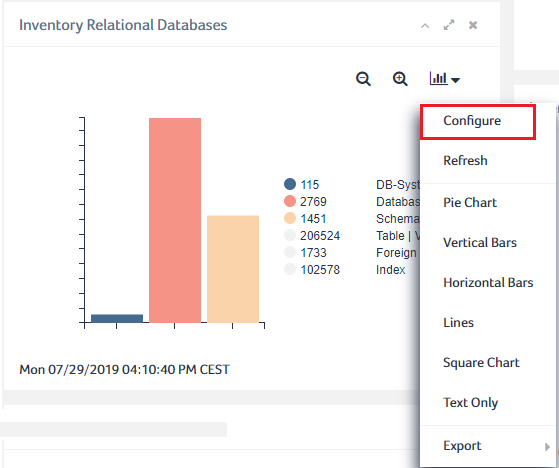
Inventory Relational Databases |
Displays the number of database items such as database systems, databases, schemas, table or views, foreign keys, and indexes. |
|
Inventory Reporting |
Displays the number of reporting items such as report packages, schemas, structures, and reports. |
| Inventory OLAP | Displays the number of Online Analytical Processing items such as OLAP packages, schemas, cubes, dimensions, hierarchies, and levels. |
|
Inventory Transformation |
Displays the number of ETL items such as systems, activities, tasks, transformations, parameters, and transformation types. |
|
The items for the Inventory charts described above are counted in chunks. When the counting is in progress, the chart widget displays the "Refreshing..." text message in the chart panel. This text message disappears when the counting is completed. The chart widget displays the chart after the counting is completed. You can perform other tasks while the chart preparation is in progress.
|
|
|
Inventory Grouped by Root Item |
Displays the number of items of a selected type grouped by the item’s root item such as the item that spans the namespace for the item. |
| Inventory Personal Information | Displays the number of personal data related items such as personal information, PI structures, privacy impact assessments, privacy security measures, and privacy policies. |
|
Linked Business Terms |
Displays the number of terms in a selected glossary that might provide a definition for another item (with the former being grouped by the type of the defined item). |
| Most Common Personal Data | Displays the most common personal information items with the number of linked technical items. |
| Personal Information | Displays the number of personal information items by category, classification, or closure rule. |
| Privacy Impact Assessments by Risk Severity | Displays the number of privacy impact assessments by risk severity. |
| Privacy Impact Assessments by Sending Data Outside EU | Displays the number of privacy impact assessments by sending data outside EU (yes, no, or not defined). |
| Privacy Impact Assessments by Using Sensible PI | Displays the number of privacy impact assessments by using sensible PIs (yes, no, or not defined). |
| Privacy Impact Assessments with Issue | Displays the number of privacy impact assessments with and without issues. |
|
Repository Usage Statistics |
Displays Rochade usage data for a selected month such as, access time per user; parallel sessions per day, weekday, and time of day; and logins per client, day, and user. |
|
Task Metrics |
Displays the number of approved terms, terms in process, newly created terms, rejected terms, and acronyms in a selected glossary. |
To configure a chart portlet
- Click the Configure icon in the dashboard and select the required chart name from the Configure Portal dialog. For example, select Inventory Relational Databases chart from EDI Browser option and click OK in the Configure Portal dialog. The Inventory Relational Databases chart page is displayed.
- Click Configure to configure the chart.
- Pie chart: A circle divided into slices to visualize proportions
- Vertical lines: Vertically arranged rectangular bars of different length to visualize proportions
- Horizontal lines: Horizontally arranged rectangular bars of different length to visualize proportions
- Square chart: A square divided into smaller squares and rectangles of different sizes to visualize proportions
- Text only: A list of the entries of the selected column with the number of times that entry occurs.
- No sorting: The chart entries are displayed alphabetically.
- Start with the smallest: The chart entries are sorted, beginning with entry for which the fewest items exist.
- Start with the biggest: The chart entries are sorted, beginning with entry for which the most items exist.
- Multi color
- Mono color
- Show dimension labels in x-axis
- Show dimension labels in y-axis
- Show value labels in chart
- No cache, get data on startup
- Use cache, refresh automatically after a delay
- Use cache, don’t refresh automatically
- Modify the settings as required, then click OK to apply your changes.
The Configure Settings of this Chart dialog opens.
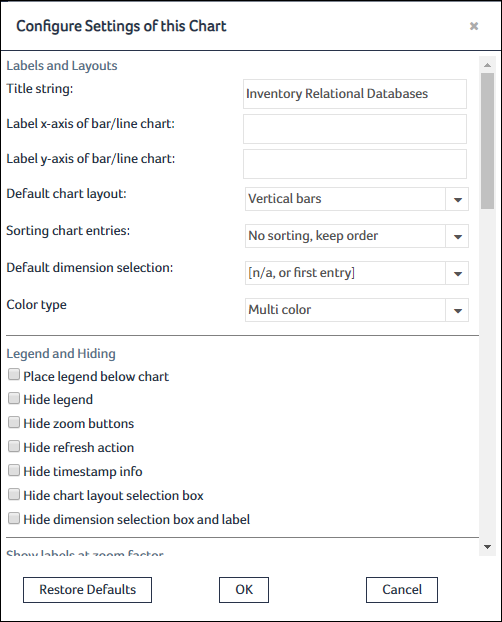
The Configure Settings dialog contains the following fields.
| Setting | Description |
|---|---|
| Labels and Layouts | |
|
Title string |
Specifies the title for the chart. |
| Label x-axis of bar/line chart | Specifies the label (name) for x-axis. This option is applicable only for the bar and line charts. |
| Label y-axis of bar/line chart | Specifies the label (name) for y-axis. This option is applicable only for the bar and line charts. |
|
Default chart layout |
Specifies the default layout for the chart. These are the available values: |
|
Sorting chart entries |
Specifies the sort order for the chart entries. These are the available values: |
|
Default dimension selection |
(Charts with dimensions only.) Specifies the default dimension for the chart. |
| Color type |
Specifies the type of the color that must be used. Available values are: |
| Legend and Hiding | |
|
Place legend below chart |
Specifies whether the legend should be displaced to the right of the chart or below it. |
|
Hide legend |
Specifies whether the legend should be displayed in the chart. |
|
Hide dimension labels in chart |
Specifies whether the dimension labels should be displayed at the chart entries. |
|
Hide zoom buttons |
Specifies whether the zoom buttons should be displayed in the chart. |
|
Hide refresh action |
Specifies whether the refresh action should be displayed in the chart menu. |
|
Hide timestamp info |
Specifies whether the timestamp should be displayed in the chart. |
|
Hide chart layout selection box |
Specifies whether the chart types should be displayed in the chart menu. |
|
Hide dimension selection box and label |
(Charts with dimensions only.) Specifies whether the dimension drop-down list should be displayed in the chart. |
| Show labels at zoom factor |
Specifies the minimum zoom factor at which the labels have to appear. Select one of the following options: |
| Adjusting Sizes and Margins | |
|
Zoom of chart area |
Specifies the default zoom for the chart. |
|
Height of chart area |
Specifies the chart height. |
|
Width of chart area |
Specifies the chart width. |
|
Top margin of chart area |
Specifies the top margin for the chart. |
|
Bottom margin of chart area |
Specifies the bottom margin for the chart. |
|
Left margin of chart area |
Specifies the left margin for the chart. |
|
Right margin of chart area |
Specifies the right margin for the chart. |
|
Width of dimension selection box |
Specifies the width for the dimension drop-down list. |
|
Rotate x-axis label |
Specifies the rotation angle for the labels on the chart’s x-axis. |
| Refresh and Caching on Startup | |
|
Refresh periodically |
Specifies whether auto-refresh is to be used and the number of minutes after which the chart content is updated. The valid range is from 0 to 60 minutes. The value zero represents that the refresh timer is disabled. You can use the slider to increase or decrease the refresh timer value. |
|
Caching chart values |
Specifies the cache mechanism for the chart. These are the available values: |
|
Customize Colors for Current Values |
Specifies the color for the chart entries. |
|
Inventory Chart Specific Configuration |
(Inventory charts only.) Specifies the item types to be included in the chart and the corresponding plug-in queries. |
To select the chart type for a chart portlet
- Click the Configure icon in the chart portlet.
- Select the chart type from the menu. For example, select the Vertical Bars option.
The chart portlet switches to the selected type.
To select the dimension for a chart portlet
- Select the dimension from the drop-down list at the top of the portlet.
The chart portlet switches to the selected dimension.
To hide a chart entry
- Click the dot icon of the chart entry that you want to hide. For example, click the orange color dot icon for the entry "Data File" to hide it.

The selected entry is removed from the chart.
To view the hidden chart entry, click its dot icon again.
To display a list of the items underlying a chart entry
- Click the entry in the chart for which you want to display the items.
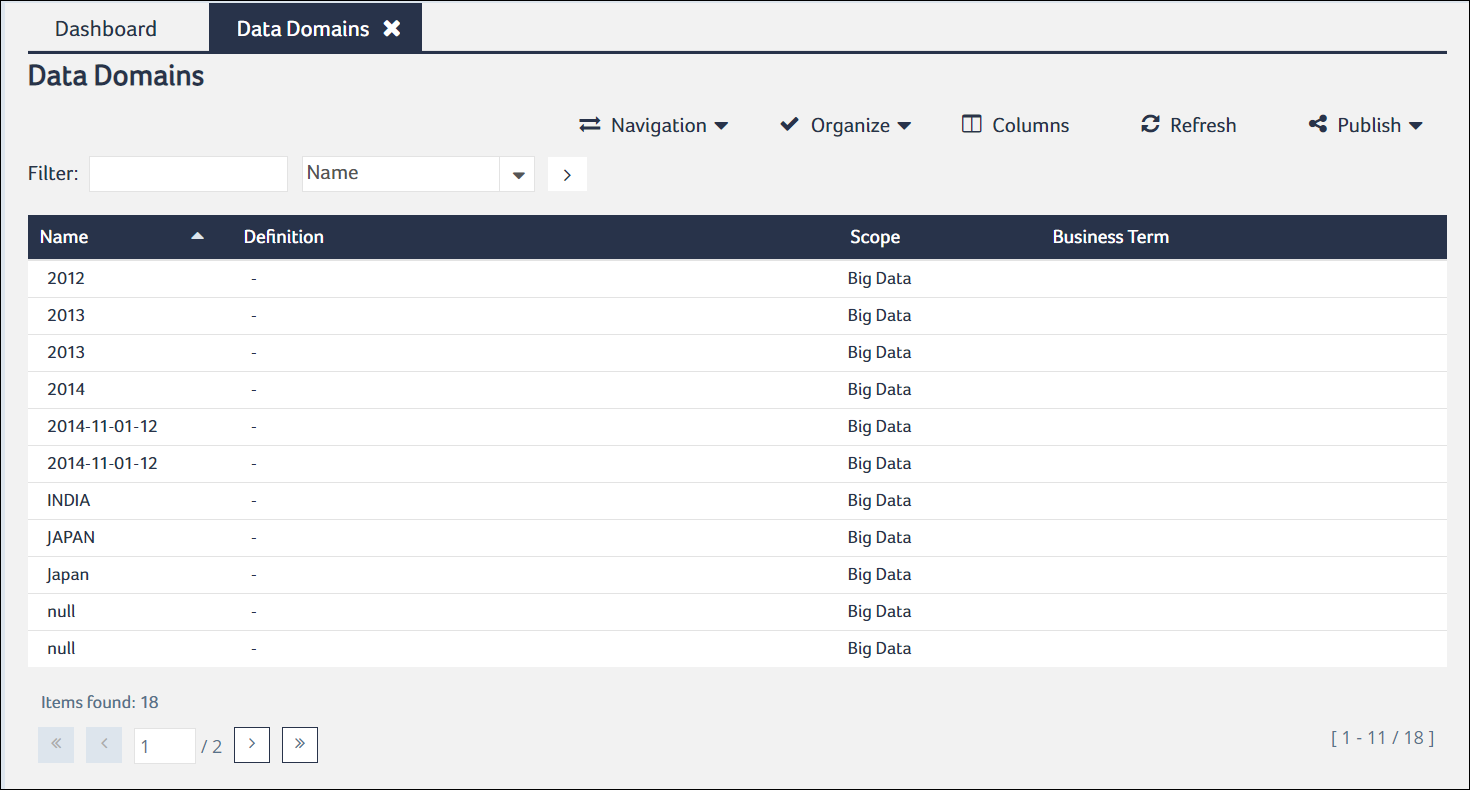
- If the Query Parameter dialog opens, enter the parameters (optional), and click Run.
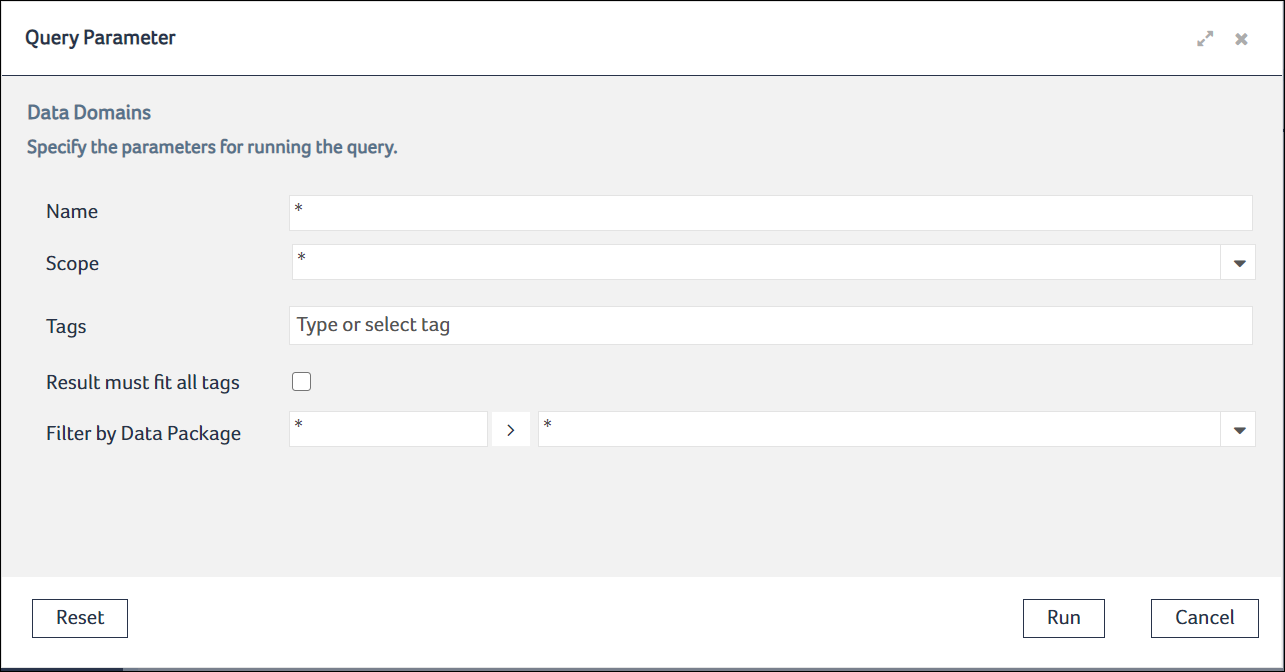
A table view opens listing the corresponding items.
To export the contents of a chart portlet as an SVG image
- Click the Configure icon in the chart portlet.
- Select Export as SVG.
- The Open dialog of your Web browser displays.
- Select whether you want to open or save the exported SVG image.

To export a chart portlet to PDF
- Click the Configure icon in the chart portlet.
- Select Export as PDF.
- The Open dialog of your Web browser displays.
- Select whether you want to open or save the exported PDF.